Information and excerpts from Wikipedia Wind Power article and Orders of Magnitude article, as well as from other Web sites listed below.
- At the end of 2008, worldwide nameplate capacity of wind-powered generators was 121.2 gigawatts (GW). Hoover Dam peak output: 2 gigawatts.
- Since wind speed is not constant, a wind farm's annual energy production is never as much as the sum of the generator nameplate ratings multiplied by the total hours in a year. The ratio of actual productivity in a year to this theoretical maximum is called the capacity factor. Typical capacity factors are 20–40%, with values at the upper end of the range in particularly favourable sites
- In 2008, wind power produced about 1.5% of worldwide electricity usage; and is growing rapidly, having doubled in the three years between 2005 and 2008.
- Several countries have achieved relatively high levels of wind power penetration, such as 19% of stationary electricity production in Denmark, 11% in Spain and Portugal, and 7% in Germany and the Republic of Ireland in 2008.
- As of May 2009, eighty countries around the world are using wind power on a commercial basis
- Danger to birds and bats has been a concern in some locations. However, studies show that the number of birds killed by wind turbines is negligible compared to the number that die as a result of other human activities, and especially the environmental impacts of using non-clean power sources. Fossil fuel generation kills around twenty times as many birds per unit of energy produced than wind-farms. Bat species appear to be at risk during key movement periods. Almost nothing is known about current populations of these species and the impact on bat numbers as a result of mortality at windpower locations. Offshore wind sites 10 km or more from shore do not interact with bat populations.
- According to the Energy Information Agency, the average US household uses 888 kWh per month, or 10,656 kWh per year. An average 1.5-MW turbine would produce the same amount of electric energy as that used by almost 332 households over a year. wind-watch.org
- In 2004, wind energy cost a fifth of what it did in the 1980s.
- A British Wind Energy Association report gives an average generation cost of onshore wind power of around 5 and 6 cents per kWh (2005). Cost per unit of energy produced was estimated in 2006 to be comparable to the cost of new generating capacity in the US for coal and natural gas: wind cost was estimated at $55.80 per MWh, coal at $53.10/MWh and natural gas at $52.50. Other sources in various studies have estimated wind to be more expensive than other sources (see Economics of new nuclear power plants, Clean coal, and Carbon capture and storage).
- When comparing renewable and conventional power sources costs, several internal cost factors have to be considered. Note we are not here talking about price, ie actual selling price, since this can be affected by a variety of factors such as subsidies on some energy and sources and taxes on others:
- Capital costs (including waste disposal and decomissioning costs for nuclear energy)
- Operating and maintenance costs
- Fuel costs (for fossil fuel and biomass sources, and which may be negative for wastes)
- Expected annual hours run
- To evaluate the cost of production of electricity, the streams of costs are converted to a net present value using the time value of money. Inherently renewables are on a decreasing cost curve, while non-renewables are on an increasing cost curve.
- There are additional costs for renewables in terms of increased grid interconnection to allow for diversity of weather and load, but these have been shown in the pan-European case to be quite low, showing that overall wind energy costs about the same as present day power.
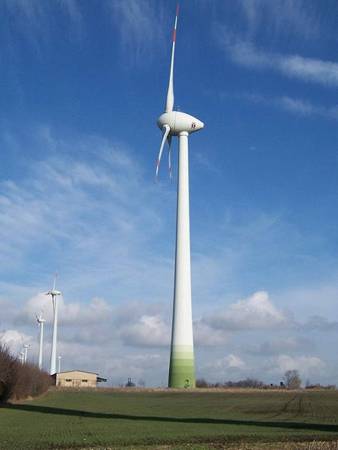 6 megawatt Enercon 112 Turbine
|
 |
Types of Wind-Harnessing Systems
- Conventional wind turbines with propeller blades.
- Floating wind turbines: wind turbines mounted on a floating structure that allows the turbine to generate electricity farther out in the sea, where the wind is stronger and steadier. The electricity generated is sent to the shore through undersea cables. Wikipedia Floating Wind Turbine article
- Kites: MS Beluga Skysails is the world's first commercial container cargo ship which is partially powered by a 160-square-metre (1,700 sq ft), computer-controlled kite. The kite could reduce fuel consumption by 20%
- Wind-diesel Hybrid Power Systems combine diesel generators and wind turbines. Wikipedia Wind-Diesel Hybrid Power Systems article
Excerpt from Wikipedia Wind Power article
- A new Carbon Trust study into the potential of small-scale wind energy has found that small wind turbines could provide up to 1.5 terawatt hours (TW·h) per year of electricity (0.4% of total UK electricity consumption), saving 0.6 million tonnes of carbon dioxide (Mt CO2) emission savings. This is based on the assumption that 10% of households would install turbines at costs competitive with grid electricity, around 12 pence (US 19 cents) a kWh
Excerpt from the Energy Bible (http://energybible.com/wind_energy/wind_speed.html)
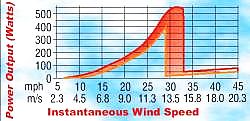
One of the key things to know about wind speed is that the amount of energy which wind can generate is not a one to one function. Rather energy increases by the cube of the wind speed. If you double the wind speed, you get eight times the energy. That is one reason that looking at wind maps is so useful. Even a small difference in wind speed within a given area can have a big impact on the amount of energy a wind turbine can generate. It is also one of the reasons why a taller wind tower can make so much of a difference. If the wind speed increases even a few miles an hour by going with a taller tower the energy generation potential goes way up (see sidebar chart).
One way to get a sense of the amount of energy a wind turbine will produce at different speeds is look at a power curve graph. Most wind turbine manufacturers will show the power curve for their particular turbines. This type of chart shows the power output (usually in watts) on one axis and the wind speed on the other. The chart below shows power curve for an Air-X wind turbine. It should be noted that the sudden drop off at above 30 mph is caused by a safety cut off.